About one in four online apparel orders comes back. Coresight Research puts the average US online apparel return rate at 24.4%, and the top reason brands report is size and fit, named by 53% of apparel decision-makers. Color came second at 16%. Damage came third at 10%.
Read that list again. The top two reasons are both things a shopper is supposed to learn from your product page. Size and fit, and color, are information problems before they are logistics problems.
This post is about the data. Where the numbers come from, what they actually tell a fashion operator, and how to use accurate fit visuals (including AI-generated on-model content) to go after the slice of returns you can actually control. If you want the broader playbook, we covered that in how to reduce fashion returns with better product visuals. This one goes deeper on measurement.
The Headline Numbers, Sourced
Return statistics get recycled across the internet until nobody knows where they came from. Here are the figures worth using, with their sources.
| Metric | Figure | Source |
|---|---|---|
| Share of US online sales returned (2025) | 19.3% | NRF and Happy Returns, 2025 Retail Returns Landscape |
| Total US retail returns (2025, projected) | $849.9 billion | NRF and Happy Returns |
| US online apparel return rate | 24.4% | Coresight Research (2023 survey) |
| Top return reason for online apparel | Size/fit, 53% of respondents | Coresight Research |
| Second and third reasons | Color 16%, damage 10% | Coresight Research |
| Estimated processing cost of US apparel returns | $25.1 billion (2023) | Coresight Research |
| Share of returns estimated fraudulent | 9% | NRF and Happy Returns |
A few things stand out for fashion operators:
- Apparel runs above the ecommerce average. 24.4% versus 19.3% overall. Some brands, especially in womenswear, swimwear, and occasion wear, report far higher.
- Processing cost is huge relative to the merchandise. Coresight estimated $38 billion of apparel returns came with about $25.1 billion in processing costs. Every return eats shipping, inspection, repackaging, and often a markdown.
- Fraud is real but small. At around 9%, fraud matters, but it is not the main story. The main story is honest customers who got the wrong thing for them.
What the Return Reason Codes Show
A 2024 academic study in Transportation Research Part E, "The billion-pound question in fashion e-commerce", analyzed real return data from a UK fashion retailer. The breakdown by category is useful:
- Womenswear: "too small" and "too big" together made up 28.5% of returns
- Childrenswear: "too small" was the top reason at 22%, followed by "too big" at 18.5%
- Other categories: "too small" at 20.5% and "too big" at 16%
Notice that these are just the two explicit size codes. They don't include "doesn't suit me", "not as pictured", or "style not as expected", which often hide fit and drape problems the shopper couldn't name precisely.
Why Fit Returns Are Mostly an Information Gap
Every fit-related return follows the same chain:
- The shopper looks at the product page
- They form a mental picture of how the garment will sit on their body
- The garment arrives
- Reality doesn't match the mental picture
- It goes back
You can't control the shopper's body or your factory's grading overnight. You can control step 2. The quality of the mental picture depends almost entirely on the visual information on the page.
The Three Gaps Your Visuals Have to Close
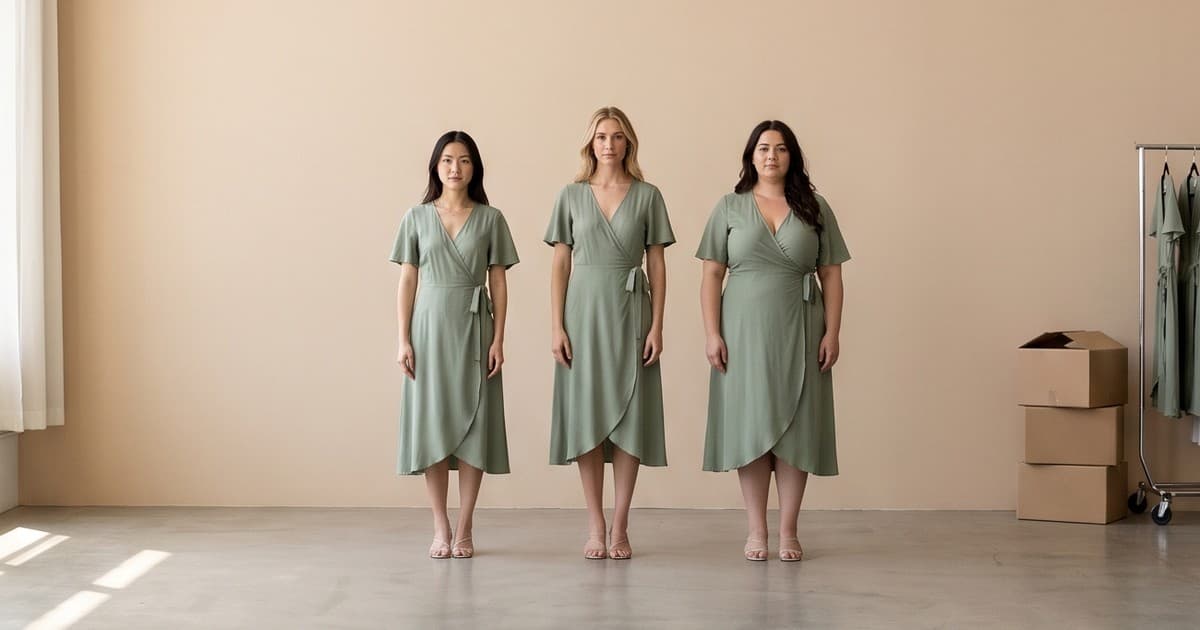
1. The body gap. If every product is shown on one model at one size, a shopper who is 5'2" and a size 14 has to guess how that dress behaves on her. That guess is where bracketing starts - ordering two or three sizes with a plan to return the rest.
2. The drape and movement gap. A static, perfectly pinned studio shot hides how fabric moves. Is the knit clingy? Does the skirt flare or hang flat? Does the waistband roll when sitting down? Still images answer these badly. Motion answers them well.
3. The color gap. Coresight's 16% color figure is the second-biggest lever. Over-edited images, inconsistent lighting across colorways, and screen-to-reality differences all drive "not as pictured" returns.
What "Accurate Fit Visuals" Actually Means
Better visuals do not mean prettier visuals. A dramatic editorial campaign image can actually increase returns if it sets expectations the product can't meet. For return reduction, accuracy beats aesthetics.
Here is what an accurate fit visual set includes:
- On-model images, not just flat lays or ghost mannequin. A shopper needs a human body for scale and shape reference.
- Multiple body types and sizes. At minimum, show your core size and one size at each end of your range. Extended-size brands should go further (we covered this in our guide to AI fashion photography for plus-size and extended sizing brands).
- Model height and size worn, stated in text. "Model is 5'9" and wears a size S" is a tiny line of copy that does real work.
- Front, back, side, and detail angles. Rise, back length, and side seam fit are common surprise points.
- Short motion clips. Walking, turning, sitting. Fabric behavior is fit information.
- Color-accurate variants. Every colorway shown on-model with consistent lighting, not one hero color and swatches for the rest.
Why Brands Rarely Ship All of This
The honest reason is cost and time. A traditional shoot that covers every SKU in three sizes, four angles, plus motion, in every colorway, multiplies your shoot budget several times over. Most brands compromise. They shoot the hero color on one sample-size model, add flat lays for the other colors, and accept the return rate.
That compromise is exactly where AI production changes the math.
How AI Fit Visuals Close the Gap
AI on-model generation takes your real product images and renders the garment on virtual models. Done properly, it lets you produce the full accurate visual set above without booking extra shoot days for every size and color.
What It Lets You Do That Was Previously Too Expensive
| Visual need | Traditional approach | AI production approach |
|---|---|---|
| Garment on 3+ body types | Cast and shoot 3+ models per SKU | Generate the same garment on multiple virtual models |
| Every colorway on-model | Shoot every sample or retouch heavily | Render each colorway from product images |
| Motion clips per SKU | Separate video crew and edit time | Generate short on-model video from the same assets |
| Back and side angles | Extra setups per look | Generate additional angles from your references |
| Fast turnaround for new drops | Weeks from sample to live page | Days, often less |
If you sell many colorways, the color gap alone is worth attacking this way. See our guide on showing 8 colorways with AI product photography.
The Accuracy Rule: Garment Fidelity Comes First
There is one big caveat. AI visuals only reduce returns if they are faithful to the real product. An AI image that smooths out a seam, invents a nicer drape, or shifts the color will create exactly the expectation gap you're trying to close.
When you evaluate AI output for return reduction, check:
- Pattern and print placement match the actual garment
- Hardware, trims, and logos are reproduced correctly
- Fabric weight reads true - a heavyweight knit shouldn't look like jersey
- Length and proportions are consistent with the size shown
- Color matches a calibrated reference of the physical sample
We wrote a full checklist in our guide to AI-generated clothing photo accuracy. For return reduction specifically, run every new SKU's AI set past someone who has handled the physical sample before it goes live.
Where Motion Fits In
Video is the strongest single tool against drape surprises. Short clips of a model walking, turning, or sitting show stretch, swing, and structure in ways stills can't. Platforms like Tellos use leading AI video models such as Kling, Sora, and Runway as underlying technology, wrapped in a fashion-specific workflow that keeps the garment consistent from frame to frame. For PDP placement ideas, see our post on AI model videos for product pages.
How to Measure Whether Fit Visuals Are Reducing Your Returns
This is where most brands fall short. They update imagery, see returns dip during a quiet month, and declare victory. Or they see returns rise during a holiday rush and give up. You need a cleaner test.
Step 1: Get Your Baseline by SKU, Not Store-Wide
A blended return rate hides everything. Pull at least 90 days of data and calculate:
- Return rate per SKU (units returned / units sold)
- Return rate by reason code per SKU
- Return rate by size per SKU
- Bracketing rate: orders containing the same style in two or more sizes
Sort by fit-related returns. Your top 20 to 50 SKUs by fit returns are your test pool.
Step 2: Fix Your Reason Codes First
If your returns portal offers "other" as an option, a big chunk of useful data is disappearing. Use specific, mutually exclusive codes:
- Too small
- Too big
- Length not as expected
- Fabric or feel not as expected
- Color not as pictured
- Style didn't suit me
- Damaged or defective
- Changed my mind
Add an optional free-text box. Those comments often reveal exactly which visual is misleading ("looked longer on the model").
Step 3: Run a Controlled Comparison
Split your test pool into two comparable groups by category, price point, and historical return rate.
- Group A: add the full accurate fit visual set (multiple body types, motion, every colorway on-model, model size stated)
- Group B: leave as is
Run the comparison for at least one full return window after enough units ship. For most brands that's 60 to 90 days. Avoid launching the test right before a major sale period, when bracketing and impulse buying spike.
Step 4: Track the Right Metrics
| Metric | Why it matters |
|---|---|
| Fit-related return rate per SKU | The direct target of better fit visuals |
| Color-related return rate | Tests colorway accuracy |
| Bracketing rate | Shows whether shoppers feel confident choosing one size |
| Conversion rate | Better visuals should not hurt it, and often help |
| Net revenue per visitor | The number that combines conversion and returns |
| Exchange vs refund share | An exchange keeps revenue even when fit misses |
Net revenue per visitor is the most honest single metric. A visual change that lifts conversion but also lifts returns may not be a win. One that holds conversion steady and cuts returns is.
Step 5: Read the Results Carefully
- If fit returns drop but color returns don't, your body-type coverage worked but your colorways need attention.
- If bracketing drops, shoppers are trusting a single size choice. That's one of the clearest signals your visuals are working.
- If nothing moves on a SKU, the problem may be the product itself (grading, inconsistent sizing across production runs). Visuals can't fix a garment that doesn't match its own size chart. Pass that data to your product team.
Doing the Math on Your Own Store
You don't need industry averages to justify the work. Use your own numbers.
Take a store doing $3 million in annual online revenue with a 25% return rate. That's $750,000 in returned merchandise. Suppose half of that is fit-related, consistent with the share most apparel brands report. That's $375,000 of fit returns.
Now apply a conservative assumption. If accurate fit visuals cut fit-related returns by just 10%, that's about $37,500 in merchandise that stays sold. Add the processing savings on each avoided return (shipping labels, handling, repacking, markdowns on unsellable items), and the real number is higher.
Then compare it against the cost of producing the visuals. With traditional shoots, adding multiple body types and motion to hundreds of SKUs can easily cost more than the savings. With AI production, the cost per SKU drops far enough that the math usually works even with a modest return reduction.
Run your own version of this with your actual return rate, fit share, and average order value. It turns "we should improve our photos" into a budget line with a clear payback.
Common Mistakes When Using Visuals to Cut Returns
Showing aspirational instead of representative. If every model is the same height and build, your imagery is still telling most shoppers to guess.
Over-retouching. Smoothing every wrinkle and pinning every garment in the back creates a fit no real body will reproduce. Shoppers notice when the product arrives.
Putting fit visuals below the fold. If the multi-body-type images or motion clip sit at position eight in the gallery, most mobile shoppers will never see them. Put the most informative fit visual in the first two or three slots.
Ignoring mobile. Most fashion traffic is mobile. Test that your motion clips load fast and your size info is readable without zooming. Our post on Core Web Vitals and product video covers how to keep pages fast.
Changing everything at once. If you redo imagery, size charts, and the returns policy in the same week, you'll never know which change moved the number.
Treating AI output as automatically correct. Every AI visual set needs a fidelity check against the real sample. Inaccurate AI imagery raises returns, it doesn't lower them.
Where Fit Visuals Sit in a Full Returns Strategy
Visuals are one lever among several. The strongest returns programs combine:
- Accurate fit visuals (the topic of this post)
- Size recommendation tools based on body data or past purchases
- Fit notes in copy, such as "runs small, size up if between sizes"
- Review prompts that ask for height, weight, and size purchased
- Exchange-first returns flows that keep the revenue when fit misses
- Feedback loops to product teams when a SKU's return data points to a grading problem
Visuals pair well with every item on that list. A size tool that recommends a medium is more convincing when the shopper can also see the medium on a body like theirs. If you're weighing try-on technology, our comparison of virtual try-on with AI models vs AR fitting rooms covers the tradeoffs.
Summary
- US online apparel returns run around 24.4%, above the 19.3% ecommerce average.
- Size and fit is the top return reason, named by 53% of apparel brands. Color is second at 16%.
- Both are information gaps. The product page failed to set an accurate expectation.
- Accurate fit visuals mean multiple body types, motion, every colorway on-model, and stated model sizes.
- AI production makes that full visual set affordable across a whole catalog, as long as garment fidelity is checked.
- Measure by SKU and reason code, run a controlled comparison, and judge results on net revenue per visitor and bracketing rate.
Returns will never hit zero in fashion. But the avoidable slice, the part caused by shoppers guessing, is large, measurable, and worth going after.
Start Showing Shoppers the Real Fit
Tellos turns your existing product images into accurate on-model photos and video across body types, sizes, and colorways, without booking another shoot. Give every shopper a clearer picture before checkout, and stop paying for returns that better visuals could have prevented.